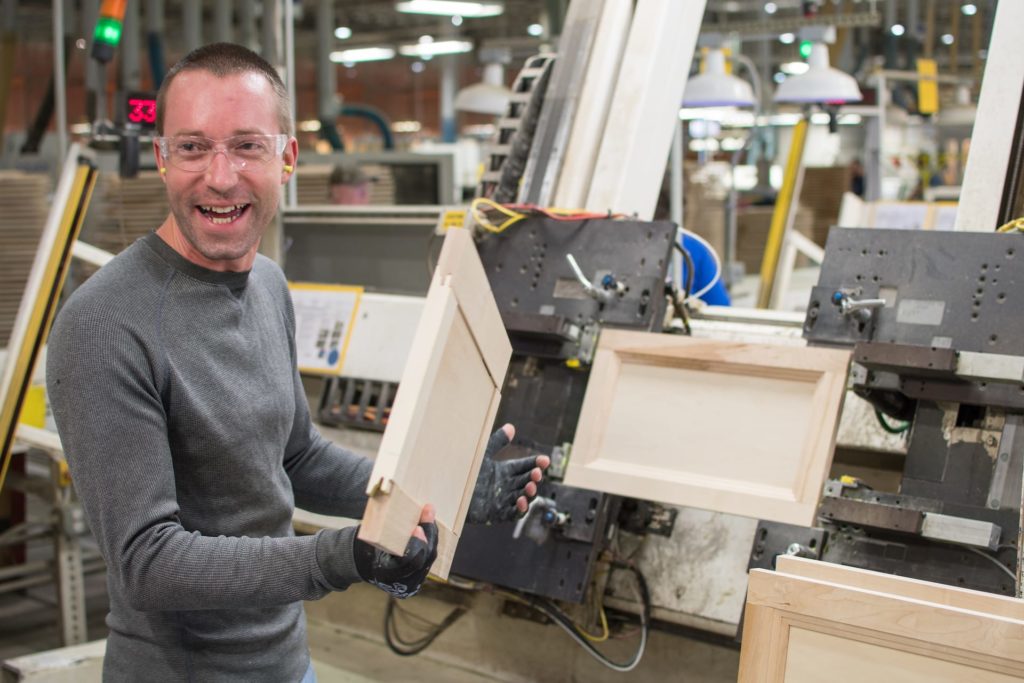
Hardy County has experienced a growth rate of more than 26 percent in the last 20 years. With a growing workforce of highly trained employees and growth industries such as poultry, wood products, manufacturing, and electronics, the county continues to move forward at a record pace.
The Hardy County labor pool offers growing companies energetic, dedicated and skilled employees at competitive wages. With both technical and liberal arts colleges, plus some of the most innovative and comprehensive career-ready training programs, Hardy County’s workforce is ready to meet the needs of your company.
 Demographics
| Subject | Total | Labor Force Participation Rate | Employment/Pop ulation Ratio | Unemployment rate |
|---|---|---|---|---|
| Estimate | Estimate | Estimate | Estimate | |
| Population 16 years and over | 11,423 | 57.3% | 53.4% | 6.9% |
| AGE | ||||
| 16 to 19 years | 611 | 37.8% | 26.8% | 29.0% |
| 20 to 24 years | 641 | 68.0% | 57.1% | 16.1% |
| 25 to 29 years | 780 | 76.4% | 68.8% | 9.9% |
| 30 to 34 years | 810 | 71.6% | 68.5% | 4.3% |
| 35 to 44 years | 1,722 | 81.8% | 78.0% | 4.5% |
| 45 to 54 years | 2,093 | 77.4% | 72.4% | 6.5% |
| 55 to 59 years | 1,063 | 67.1% | 65.9% | 1.8% |
| 60 to 64 years | 974 | 46.6% | 44.5% | 4.6% |
| 65 to 74 years | 1,647 | 28.4% | 27.4% | 3.2% |
| 75 years and over | 1,082 | 4.1% | 2.8% | 31.8% |
| RACE AND HISPANIC OR LATINO ORIGIN | ||||
| White alone | 10,751 | 56.9% | 52.7% | 7.4% |
| Black or African American alone | 450 | 48.2% | 48.2% | 0.0% |
| American Indian and Alaska Native alone | 17 | 100.0% | 100.0% | 0.0% |
| Asian alone | 169 | 100.0% | 100.0% | 0.0% |
| Native Hawaiian and Other Pacific Islander alone | 0 | – | – | – |
| Some other race alone | 23 | 95.7% | 95.7% | 0.0% |
| Two or more races | 13 | 69.2% | 69.2% | 0.0% |
| Hispanic or Latino origin (of any race) | 399 | 98.0% | 86.7% | 11.5% |
| White alone, not Hispanic or Latino | 10,473 | 55.8% | 51.9% | 7.0% |
| Population 20 to 64 years | 8,083 | 71.8% | 67.4% | 6.1% |
| SEX | ||||
| Male | 3,993 | 75.8% | 71.3% | 5.8% |
| Female | 4,090 | 68.0% | 63.6% | 6.5% |
| With own children under 18 years | 1,082 | 74.0% | 68.4% | 7.6% |
| With own children under 6 years only | 210 | 86.7% | 86.7% | 0.0% |
| With own children under 6 years and 6 to 17 years | 212 | 56.1% | 56.1% | 0.0% |
| With own children under 6 to 17 years only | 660 | 75.8% | 66.5% | 12.2% |
| Source: US Census Bureau | ||||
Labor Statistics
| Subject | Estimate | Margin of Error | Percent | Percent Margin of Error |
|---|---|---|---|---|
| EMPLOYMENT STATUS | ||||
| Population 16 years and over | 11,423 | +/-96 | 11,423 | (X) |
| In labor force | 6,549 | +/-363 | 57.3% | +/-3.2 |
| Civilian labor force | 6,549 | +/-363 | 57.3% | +/-3.2 |
| Employed | 6,096 | +/-367 | 53.4% | +/-3.2 |
| Unemployed | 453 | +/-133 | 4.0% | +/-1.2 |
| Armed Forces | 0 | +/-18 | 0.0% | +/-0.3 |
| Not in labor force | 4,874 | +/-368 | 42.7% | +/-3.2 |
| Civilian labor force | 6,549 | +/-363 | 6,549 | (X) |
| Unemployment Rate | (X) | (X) | 6.9% | +/-2.0 |
| COMMUTING TO WORK | ||||
| Workers 16 years and over | 6,051 | +/-363 | 6,051 | (X) |
| Car, truck, or van — drove alone | 4,867 | +/-356 | 80.4% | +/-3.6 |
| Car, truck, or van — carpooled | 570 | +/-207 | 9.4% | +/-3.3 |
| Public transportation (excluding taxicab) | 11 | +/-15 | 0.2% | +/-0.2 |
| Walked | 404 | +/-130 | 6.7% | +/-2.2 |
| Other means | 11 | +/-24 | 0.2% | +/-0.4 |
| Worked at home | 188 | +/-117 | 3.1% | +/-1.9 |
| Mean travel time to work (minutes) | 24.8 | +/-2.7 | (X) | (X) |
| OCCUPATION | ||||
| Civilian employed population 16 years and over | 6,096 | +/-367 | 6,096 | (X) |
| Management, business, science, and arts occupations | 1,242 | +/-229 | 20.4% | +/-3.6 |
| Service occupations | 1,350 | +/-271 | 22.1% | +/-4.1 |
| Sales and office occupations | 1,026 | +/-228 | 16.8% | +/-3.4 |
| Natural resources, construction, and maintenance occupations | 721 | +/-168 | 11.8% | +/-2.8 |
| Production, transportation, and material moving occupations | 1,757 | +/-294 | 28.8% | +/-4.7 |
| INDUSTRY | ||||
| Civilian employed population 16 years and over | 6,096 | +/-367 | 6,096 | (X) |
| Agriculture, forestry, fishing and hunting, and mining | 253 | +/-120 | 4.2% | +/-2.0 |
| Construction | 304 | +/-105 | 5.0% | +/-1.8 |
| Manufacturing | 1,529 | +/-313 | 25.1% | +/-4.9 |
| Wholesale trade | 189 | +/-112 | 3.1% | +/-1.8 |
| Retail trade | 611 | +/-185 | 10.0% | +/-2.9 |
| Transportation and warehousing, and utilities | 334 | +/-147 | 5.5% | +/-2.4 |
| Information | 64 | +/-46 | 1.0% | +/-0.7 |
| Finance and insurance, and real estate and rental and leasing | 188 | +/-79 | 3.1% | +/-1.3 |
| Professional, scientific, and management, and administrative and waste management services | 277 | +/-117 | 4.5% | +/-1.9 |
| Educational services, and health care and social assistance | 1,244 | +/-231 | 20.4% | +/-3.5 |
| Arts, entertainment, and recreation, and accommodation and food services | 554 | +/-232 | 9.1% | +/-3.7 |
| Other services, except public administration | 231 | +/-128 | 3.8% | +/-2.1 |
| Public administration | 318 | +/-139 | 5.2% | +/-2.3 |
| CLASS OF WORKER | ||||
| Civilian employed population 16 years and over | 6,096 | +/-367 | 6,096 | (X) |
| Private wage and salary workers | 4,733 | +/-412 | 77.6% | +/-4.6 |
| Government workers | 963 | +/-252 | 15.8% | +/-4.1 |
| Self-employed in own not incorporated business workers | 382 | +/-138 | 6.3% | +/-2.2 |
| Unpaid family workers | 18 | +/-28 | 0.3% | +/-0.5 |
| INCOME AND BENEFITS (IN 2016 INFLATION-ADJUSTED DOLLARS) | ||||
| Total households | 5,350 | +/-251 | 5,350 | (X) |
| Less than $10,000 | 321 | +/-109 | 6.0% | +/-2.0 |
| $10,000 to $14,999 | 344 | +/-94 | 6.4% | +/-1.7 |
| $15,000 to $24,999 | 882 | +/-217 | 16.5% | +/-4.1 |
| $25,000 to $34,999 | 768 | +/-162 | 14.4% | +/-3.0 |
| $35,000 to $49,999 | 964 | +/-237 | 18.0% | +/-4.3 |
| $50,000 to $74,999 | 949 | +/-167 | 17.7% | +/-3.0 |
| $75,000 to $99,999 | 616 | +/-166 | 11.5% | +/-3.0 |
| $100,000 to $149,999 | 357 | +/-123 | 6.7% | +/-2.3 |
| $150,000 to $199,999 | 69 | +/-61 | 1.3% | +/-1.1 |
| $200,000 or more | 80 | +/-51 | 1.5% | +/-1.0 |
| Median household income (dollars) | 39,840 | +/-3,258 | (X) | (X) |
| Mean household income (dollars) | 53,214 | +/-5,162 | (X) | (X) |
| With earnings | 3,817 | +/-274 | 71.3% | +/-3.3 |
| Mean earnings (dollars) | 49,986 | +/-4,224 | (X) | (X) |
| With Social Security | 2,338 | +/-179 | 43.7% | +/-2.9 |
| Mean Social Security income (dollars) | 16,296 | +/-1,148 | (X) | (X) |
| With retirement income | 1,004 | +/-156 | 18.8% | +/-2.8 |
| Mean retirement income (dollars) | 19,375 | +/-3,748 | (X) | (X) |
| With Supplemental Security Income | 291 | +/-97 | 5.4% | +/-1.8 |
| Mean Supplemental Security Income (dollars) | 8,149 | +/-1,375 | (X) | (X) |
| With cash public assistance income | 308 | +/-128 | 5.8% | +/-2.3 |
| Mean cash public assistance income (dollars) | 3,656 | +/-1,703 | (X) | (X) |
| With Food Stamp/SNAP benefits in the past 12 months | 690 | +/-196 | 12.9% | +/-3.4 |
| Families | 3,753 | +/-267 | 3,753 | (X) |
| Less than $10,000 | 69 | +/-45 | 1.8% | +/-1.2 |
| $10,000 to $14,999 | 121 | +/-71 | 3.2% | +/-1.8 |
| $15,000 to $24,999 | 624 | +/-166 | 16.6% | +/-4.3 |
| $25,000 to $34,999 | 492 | +/-140 | 13.1% | +/-3.8 |
| $35,000 to $49,999 | 780 | +/-197 | 20.8% | +/-5.0 |
| $50,000 to $74,999 | 671 | +/-137 | 17.9% | +/-3.5 |
| $75,000 to $99,999 | 561 | +/-148 | 14.9% | +/-3.7 |
| $100,000 to $149,999 | 333 | +/-123 | 8.9% | +/-3.2 |
| $150,000 to $199,999 | 69 | +/-61 | 1.8% | +/-1.6 |
| $200,000 or more | 33 | +/-28 | 0.9% | +/-0.7 |
| Median family income (dollars) | 45,176 | +/-3,421 | (X) | (X) |
| Mean family income (dollars) | 56,903 | +/-4,021 | (X) | (X) |
| Per capita income (dollars) | 21,956 | +/-1,983 | (X) | (X) |
| With private health insurance | 1,189 | +/-261 | 48.7% | +/-8.3 |
| With public coverage | 1,201 | +/-264 | 49.2% | +/-7.6 |
| No health insurance coverage | 403 | +/-155 | 16.5% | +/-5.9 |
| PERCENTAGE OF FAMILIES AND PEOPLE WHOSE INCOME IN THE PAST 12 MONTHS IS BELOW THE POVERTY LEVEL | ||||
| All families | (X) | (X) | 9.7% | +/-3.2 |
| With related children of the householder under 18 years | (X) | (X) | 19.0% | +/-7.6 |
| With related children of the householder under 5 years only | (X) | (X) | 12.0% | +/-10.1 |
| Married couple families | (X) | (X) | 4.2% | +/-1.9 |
| With related children of the householder under 18 years | (X) | (X) | 6.0% | +/-3.9 |
| With related children of the householder under 5 years only | (X) | (X) | 13.5% | +/-13.9 |
| Families with female householder, no husband present | (X) | (X) | 36.1% | +/-15.4 |
| With related children of the householder under 18 years | (X) | (X) | 47.6% | +/-20.3 |
| With related children of the householder under 5 years only | (X) | (X) | 19.7% | +/-25.9 |
| All people | (X) | (X) | 13.7% | +/-3.3 |
| Under 18 years | (X) | (X) | 22.4% | +/-9.0 |
| Related children of the householder under 18 years | (X) | (X) | 22.0% | +/-8.8 |
| Related children of the householder under 5 years | (X) | (X) | 18.6% | +/-11.0 |
| Related children of the householder 5 to 17 years | (X) | (X) | 23.2% | +/-11.1 |
| 18 years and over | (X) | (X) | 11.5% | +/-2.5 |
| 18 to 64 years | (X) | (X) | 11.5% | +/-3.0 |
| 65 years and over | (X) | (X) | 11.6% | +/-4.2 |
| People in families | (X) | (X) | 11.0% | +/-3.7 |
| Unrelated individuals 15 years and over | (X) | (X) | 26.7% | +/-5.8 |
| Source: US Census Bureau | ||||
| Hardy County Annual Average Labor Force Stats | |||||||
|---|---|---|---|---|---|---|---|
| 2016 | 2015 | 2014 | 2013 | 2012 | 2011 | 2010 | |
| Civilian Labor Force | 5,700 | 5,480 | 5,360 | 5,450 | 5,570 | 5,690 | 5,710 |
| Employment | 5,370 | 5,070 | 4,900 | 4,930 | 4,980 | 5,100 | 5,050 |
| Unemployment | 320 | 410 | 460 | 520 | 590 | 600 | 660 |
| Unemployment rate | 5.6 | 7.5 | 8.5 | 9.5 | 10.6 | 10.5 | 11.6 |
| Hardy County Annual Avg. Total Nonfarm Payroll Employment by Industry | |||||||
|---|---|---|---|---|---|---|---|
| 2016 | 2015 | 2014 | 2013 | 2012 | 2011 | 2010 | |
| Total nonfarm | 6,380 | 6,040 | 5,970 | 5,930 | 5,960 | 6,080 | 5,990 |
| Total private | 5,310 | 5,170 | 5,100 | 5,070 | 5,060 | 5,210 | 5,140 |
| Trade, transportation, and utilities | 790 | 770 | 760 | 780 | 800 | 790 | 780 |
| Retail trade | 600 | 570 | 570 | 580 | 560 | 570 | 580 |
| Government | 1,070 | 870 | 860 | 860 | 900 | 870 | 850 |
| Federal | 50 | 50 | 50 | 50 | 50 | 50 | 60 |
| State government | 440 | 260 | 270 | 270 | 270 | 260 | 230 |
| Local government | 590 | 570 | 550 | 550 | 590 | 570 | 560 |
| (Source: Workforce WV, LMI Section, 2018) | |||||||
Education, Workforce Development and Training
Colleges and Universities
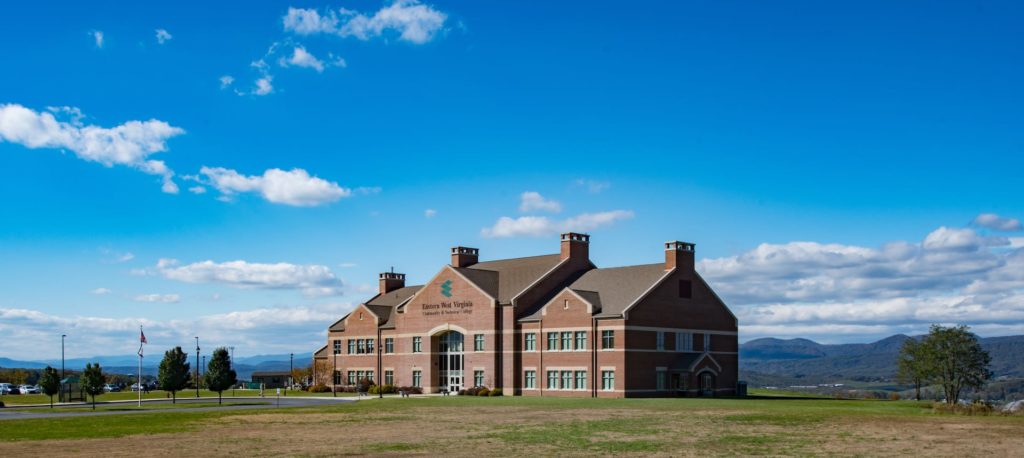
Eastern West Virginia Community and Technical College
Eastern West Virginia Community & Technical College specializes in training students for careers through hands-on learning experiences, including such growing industries as information technology, business, healthcare, elementary education and transportation. In addition to degree programs, the community college also offers affordable, short-term workforce training courses for high-demand careers.
Potomac State College
West Virginia University Potomac State College, located in Keyser, W.Va., is known for its small class sizes, student-centered focus and entrepreneurial spirit. Potomac State College offers more than 50 two-year degree programs that can transfer to WVU’s main campus or other four-year colleges. The college’s academic offerings include fast-track career and technical programs plus the Regents Bachelor of Arts for non-traditional students.
Shepherd University
Shepherd University is a public liberal arts university with more than 100 undergraduate majors and minors. In addition to its main Shepherdstown, W.Va., campus, Shepherd University also has a satellite campus in Martinsburg. The Martinsburg Center offers a variety of adult degree programs, including Regents Bachelor of Arts, Special Education Endorsement and Master of Business Administration.
Blue Ridge Community College
Blue Ridge Community and Technical College in nearby Martinsburg, W.Va., offers associate degrees, certificates, and certification training in liberal arts, business administration, and allied health fields. Blue Ridge also offers the opportunity for high school students to take courses or jump-start their careers, and has a variety of employee training solutions for businesses.
 Career and Technical Schools
South Branch Career and Technical Center
South Branch Career and Technical Center (SBCTC) is one of seven multi-county career and technical centers in the state. The school serves more than 300 students in nine different programs, including training for career-readiness in such in-demand fields as broadcasting, allied health and health informatics, information technology, applied trades and cosmetology. The center serves students from five high schools in Grant, Hardy, and Pendleton counties.
James Rumsey Technical Institute
Since 1970, James Rumsey Technical Institute (JRTI) has served as the leading provider of career and technical education for West Virginia high school students, as well as adult learners from across the Eastern Panhandle and beyond. For adult learners, JRTI offers highly skilled training in the culinary arts, healthcare, industrial and transportation sectors. High school students can accelerate their entry into the workforce with hands-on studies in everything from diesel technology to robotics.